
November
2020
Webster Hughes, PhD, Managing Principal, Multifamily Comps
This paper presents the
authors’ present opinions reflecting current market conditions, which are
subject to change without notice. It has been written for informational and
educational purposes only and should not be considered as investment advice or
as a recommendation of any particular security, strategy, or investment
product.
Purpose
of This Article
Multifamily
Comps LLC (“MFC”) has
implemented a location-based Demographic Score within its Multifamily
Predictive Analytics System (“MPAS”). The Demographic Score is used to model
the impact of location-based demographic factors on property-level valuation
and operating performance forecasts. This article explains the Demographic
Score calculation, provides an example from the MFC property database, and introduces
a color-coded heat map showing property locations with more or less demographic
risks. The article concludes with an explanation for how MFC Demographic Score
methodology and software can be customized to Client’s specifications and use
cases.
I.
Current Investment Environment
The longest business cycle in the U.S. history ended
abruptly in March 2020 as the public health crisis caused by the COVID-19 virus
spread around the world. The nation’s
economy is now amid one of the most severe recessions in almost a century and
there is high uncertainty with regards to how deep and prolonged this downturn
will be. Now eight months into the
crisis with eviction moratoriums, loan forbearance, and stop-and-start
reopening, real estate investors are grappling with how variations in renter
demographic profiles will likely impact property-level operating performance.
II.
Baseline Economic and Demographic Scenario
Assumptions
MPAS
utilizes Baseline Economic and Demographic Scenario
Assumptions as a starting point to forecast property-level revenue, expenses, CAPEX,
and valuation over forward time periods. Our Baseline Forward Scenario for Revenue
assumes a deep multi-year recession with an uncertain economic re-opening and
substantial variation across demographic profiles due to uneven expected job
loss, renter financial condition, and exposure to the COVID-19 virus. To model the
uneven economic stress across demographic profiles, we implemented a location-based
Demographic Score using Census Data sourced from a 1-mile radius of each
Property in the MFC Database. Our Demographic Score ranges from -10 (lowest economic
stress) to +10 (highest economic stress) based on a risk-weighted average of
Census items which we estimate will impact renter ability-to-pay and property-level
revenue over forward time periods.
Table 1
provides our Baseline Revenue Assumptions for Demographic Scores ranging from
-10 to +10. As the reader can see in the Table 1, we assume wide variation in
Revenue Growth based our Demographic Score. While acknowledging that we have no
historical experience with the impact of a pandemic on property-level, we bring
decades of experience in economic analysis as relates to multifamily,
applications of Census data, and all manner of investment stress analyses. It
is our professional opinion is that this wide variation is warranted and should
be included in any credible effort to forecast operating performance in the
current economic environment.
TABLE 1: Baseline Forward Scenario Assumptions (Revenue)

Industry
researchers often use metro, submarket, zip code level Census averages when
analyzing the effect of demographic factors on property operating performance. Whereas
aggregating over these larger areas may be useful when speaking in
generalities, it is not reliable for property-level analytics. MPAS uses Census
data sourced in a 1-mile radius from each of the 26,000+ properties in our
database. The importance of using tightly localized Census data is noteworthy.
In Table 2 below, we provide an example of two properties located 3 miles apart
in the same Charlotte, NC zip code with opposite Demographic Score.
TABLE 2: Opposite
Demographic Scores in the same Charlotte, NC 28205 zip code
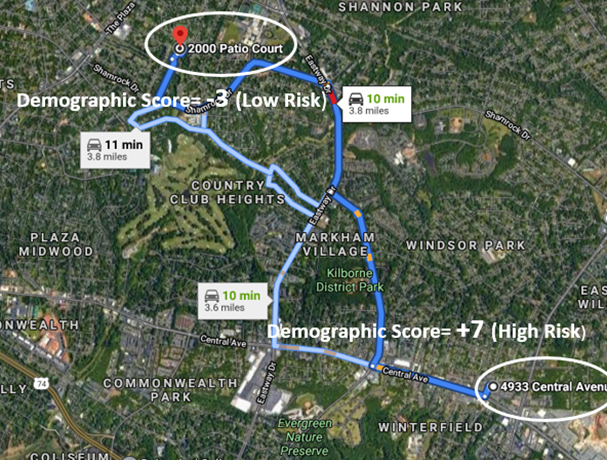
The difference in demographic profile is obvious for anyone who visits the properties. 2000 Patio Court (Demographic Score= -3) is in a leafy neighborhood next to Charlotte Country Club with high concentration of people with college degrees and working in the financial industry; 4933 Central Avenue (Demographic Score= +7) is a densely populated lower income area with high concentration of employment in construction and service industries. Table 1 shows a 12% difference in cumulative Revenue Growth for the two locations. The difference in revenue growth based on demographic profiles feeds directly into MPAS and is a primary determinant of Valuation and Operating Performance Forecasts.
Table 3 below
shows underlying calculations for 4933 Central Avenue (Demographic Score= +7).
It lists the Risk Factors and Risk Mitigants in order of component risk score.
TABLE 3: Demographic Score=+7 (High Risk), Top Risk Factors and Mitigants

III. Color-Coded Heat Map
The www.multifamilycomps.com dashboard includes color-coded heat map
based on Demographic Score (red=high-risk, green=low-risk). The map can be filtered
by Metro, Subtype, Units, and Demographic Score. Table 4 below provides an
example screenshot.
Table 4:
Color-Coded Heat Map for greater TX-Dallas-Fort Worth-Arlington CMSA

The MFC
Demographic Score methodology and software can be readily customized in two different
ways:
1)
Input
a Client’s customized specification of the strength coefficients of the various
Census data risk factors and risk mitigants used to calculate the Demographic
Score.
2)
Apply
either MFC or a Client’s customized specification to a set of locations
provided by the Client. An example
Item #1 above
translates into different Demographic Scores and therefore different MPAS
Valuation and Operating Forecasts. MPAS software applications include templates
for input and testing of a Client’s specifications of different strength
coefficients.
Item #2 above
enables a Client to specify a Demographic Score for any number of purposes and
for any set of locations. An example would an investor or lender using a
customized score to determine geographic acquisition and origination focus.
MFC has technology in place to collect over 300 Census data items sourced from 1, 3, and 5-mile radiuses of any set of locations (specified by either address or geographic coordinates). The Census Data is available historically as well. MFC used the historical data for statistical modeling and forecasts. We welcome customization and software projects using this technology.
No comments:
Post a Comment